Methods
HealthyPlan.City combines built environment datasets from different sources with demographic data from the Canadian Census to present a picture of environmental equity in urban areas for 129 cities across Canada. The data used in this tool covers municipalities in Canada with a population of over 30,000 individuals. Urban boundaries are established by Statistics Canada and are based on Census Subdivisions, which provide the administrative boundaries of all municipalities across Canada. Data is mapped for areas with a population density of 400 people per square kilometer or more. The geographic area covered by the HealthyPlan.City tool is home to 24,618,003 people. A full list of communities included in this tool is provided at the end of this page.
Demographic Data
Demographic data for vulnerable populations included in HealthyPlan.City come from the 2021 Census of Canada and were obtained for dissemination areas. A dissemination area is a small area composed of one or more neighbouring dissemination blocks. Dissemination blocks are bounded on all sides by roads and/or natural or manmade boundaries. Dissemination blocks typically represent a street block in urban areas, but can be larger in suburban areas. Dissemination blocks are the smallest areas for which population counts are reported in Canada.
We downscaled the dissemination area data by assigning the percentage of each vulnerable population group to all the dissemination blocks within each dissemination area. The dissemination block data come with total population, which allows us to calculate the absolute number and percentage of people in each vulnerable population group that live in each dissemination block.
The following vulnerable populations are included in the HealthyPlan.City tool:
- Low-income individuals: Percentage of population (all ages) under the after-tax low-income threshold.
- Children: Percentage of population under 15 years of age.
- Older adults: Percentage of population over 64 years of age.
- Visible minority individuals: Percentage of population that identify as a visible minority.
- Individuals living alone: Percentage of population in private households who live alone.
- Newly-arrived immigrants: Percentage of population who are immigrants to Canada between 2011 and 2021.
- First-generation immigrants: Percentage of population who are immigrants born outside of Canada.
- Low-income children: Percentage of children (under 18 y/o) under the after-tax low-income threshold.
- Low-income older adults: Percentage of older adults (over 64 y/o) under the after-tax low-income threshold.
- Low-income visible minority individuals: Percentage of population under the after-tax low-income cut-off threshold that identify as a visible minority.
- Low-income individuals living alone: Percentage of population under the after-tax low-income cut-off threshold that live alone.
- Low-income newly-arrived immigrants: Percentage of population under the after-tax low-income cut-off threshold who are immigrants to Canada between 2011 and 2021.
- Low-income first-generation immigrants: Percentage of population under the after-tax low-income cut-off threshold who are immigrants born outside of Canada.
Built Environment Data

Built environment data included in HealthyPlan.City are derived from a number of sources including satellite imagery, Open Street Map, and other geospatial databases. These datasets are presented under four data themes:
- Urban Climate
- Community Amenities
- Parks and Recreation
- Air and Noise pollution
The Urban Climate data theme includes three data layers:
- Average summer temperature is the average land surface temperature from May to September 2019-2021 derived from LandSat 8 satellite data in Google Earth Engine. This data was obtained using an adapted code shared on StackExchange by Edwin Osei (April 22, 2020). The average of values within each dissemination block is reported.
- Tree canopy cover is the average percentage of tree canopy cover within the dissemination block. Tree Canopy Cover data comes from Google, Meta and the World Resource Institute. Google data was available for all but 15 municipalities. High-resolution imagery was analyzed with a semantic segmentation model using polygons of trees performed by annotators. The model was aggregated to 30 m resolution and then averaged across the dissemination block. The remaining 15 municipalities were retrieved from Meta & World Resources Institute via Google Earth Engine. The proportion of cells indicating tree height 3 m or higher were aggregated to 30 m resolution and then averaged across the dissemination block.
- Flood susceptibility indicate areas that are prone to flooding. This data layer comes from Natural Resources Canada's Flood Susceptibility Index, which used machine learning algorithms to predict how likely areas are to flood based on patterns of major Canadian flood events since the 1970s. The dataset is produced at a 30 m spatial resolution. Only areas within 30 m of buildings were used to assess flood susceptibility. The average flood susceptibility across all buildings is reported. Values close to 0 indicate low susceptibility to flooding and values close to 100 show areas that are the most susceptible to flooding. Building footprints were retrieved from Microsoft Bing Maps V1.1 (2019). Statistics Canada Open Database of Buildings V2.0 (2019) was used for dissemination blocks that had buildings where Microsoft Bing Maps did not.
The Community Amenities data theme includes four data layers:
- Transit stops is the number of public transit stop locations within a 500 m walking distance. The average number of transit stops within a 500 m street network distance of all buildings within the dissemination block is reported. Transit stop amenities were extracted from the Statistics Canada Open Database of Infrastructure (Version 1.0). Statistics Canada assembled this database using General Transit Feed Specification (GTFS) data from public transit agencies across Canada. Walking routes were determined using transportation data from OpenStreetMap. Building footprints were retrieved from Microsoft Bing Maps January 2023.
- Educational facilities is the number of facilities such as early childhood educational centres, schools, vocational training centres and post-secondary institutions within a 1 km walk. The average number of educational facilities within a 1 km street network distance of all buildings within the dissemination block is reported. Educational facilities were extracted from the Statistics Canada Open Database of Educational Facilities (Version 2.1). Statistics Canada assembled this data from municipal and provincial governments’ open data portals and web pages. Walking routes were determined using transportation data from OpenStreetMap. Building footprints were retrieved from Microsoft Bing Maps in January 2023.
- Retail and services is the number of retail and services outlets such as stores, restaurants, malls, professional services, pharmacies and banks within a 1 km walk. The average number of retail and service outlets within a 1 km street network distance of all buildings within the dissemination block is reported. Retail and service amenities were extracted from the OpenStreetMap database in November 2022. Walking routes were determined using transportation data from OpenStreetMap. Building footprints were retrieved from Microsoft Bing Maps in January 2023.
- Healthy food outlets is the number of fresh food outlets such as supermarkets, groceries, delis, butchers, markets, fishmongers and bakeries within a 1 km walk. The average number of healthy food outlets within a 1 km street network distance of all buildings within the dissemination block is reported. Healthy food outlet amenities were extracted from the OpenStreetMap database in November 2022. Walking routes were determined using transportation data from OpenStreetMap. Building footprints were retrieved from Microsoft Bing Maps in January 2023.
The Parks and Recreation data theme includes three data layers:
- Large natural areas is the number of forests, beaches, wetlands, grass and nature reserves within a 1 km radius. Large natural areas were extracted from the OpenStreetMap database in November 2022.
- Parks is the number of community gardens, neighbourhood parks and large parks within a 1 km radius. Parks were extracted from the OpenStreetMap database in November 2022.
- Recreation and sports facilities is the number of recreational and sports facilities such as arenas, swimming pools, gyms, aquariums, bowling alleys, fitness centers and bingo halls within a 1 km radius. Recreational and sports facilities were extracted from the OpenStreetMap database in November 2022.
- Greenspace provision is the available greenspace (in m2) per person within a 500 m walk. Greenspaces are composed of parks, open spaces, large natural areas, outdoor recreation spaces, forests, and other similar land uses. The number of people within 500 m of a greenspace was determined using the Statistics Canada Geographic Attribute File at the dissemination block level and transportation data from OpenStreetMap. Components of greenpace provision were extracted from the OpenStreetMap database in November 2022.
The Air and Noise Pollution data theme includes two data layers:
- Air pollution is a modeled estimate of nitrogen dioxide air pollution (a marker of traffic-related air pollution) for the year 2016 developed by Hystad et al.
- Noise pollution is calculated as the number of noise points such as airports, runways, helipads, railroads, fire and ambulance stations and major roads within a 1km radius. Noise pollution features are extracted from the OpenStreetMap database in November 2022.
Equity Priority
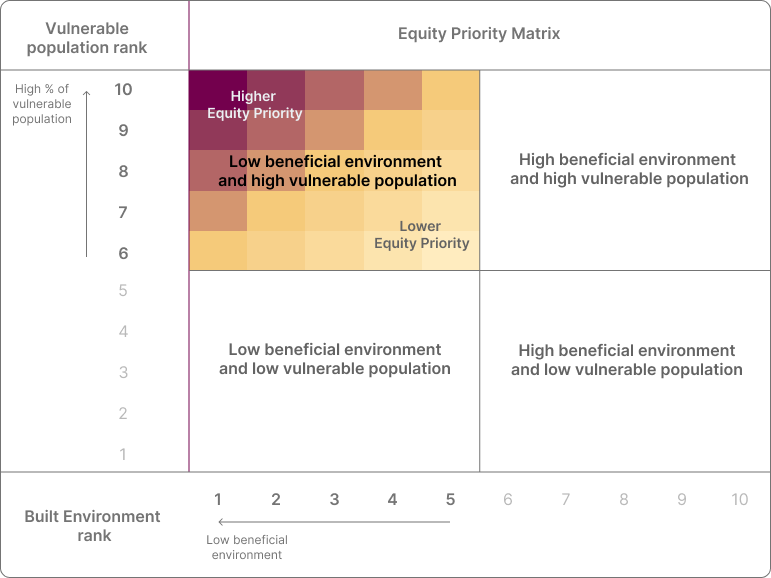
To identify locations where environmental inequity exists, the percentages of vulnerable populations and the values for the built environment indicators for all dissemination blocks within a city were ranked from 1 to 10, with 1 being the lowest 10% of the values (i.e. low percentage of vulnerable population group or the lowest levels of beneficial environment), and 10 being the highest 10% of the values (i.e. highest percentage of vulnerable population group or the highest levels of beneficial environment).
Equity Priority is identified by combining the vulnerable population ranks > 5 (higher percentages of vulnerable populations) and the built environment ranks < 6 (lower levels of beneficial environments), as shown in the Equity Priority matrix below. In these locations, vulnerable demographic groups make up a greater proportion of the population, but experience fewer benefits or more risk from the built environment relative to the city-wide median. Darker shades of red are used to show higher equity priorities.
Equity by the numbers
The Equity by the Numbers window provides additional information on environmental inequity in Canadian cities.
This window shows the percentage and number of vulnerable population individuals in the selected city that live in less beneficial built environment areas. This is obtained by dividing the number of vulnerable population individuals that live in less beneficial built environment areas (ranked < 6 for a built environment indicator; see “Equity Priority” section above) by the total number of vulnerable population individuals in the entire city.
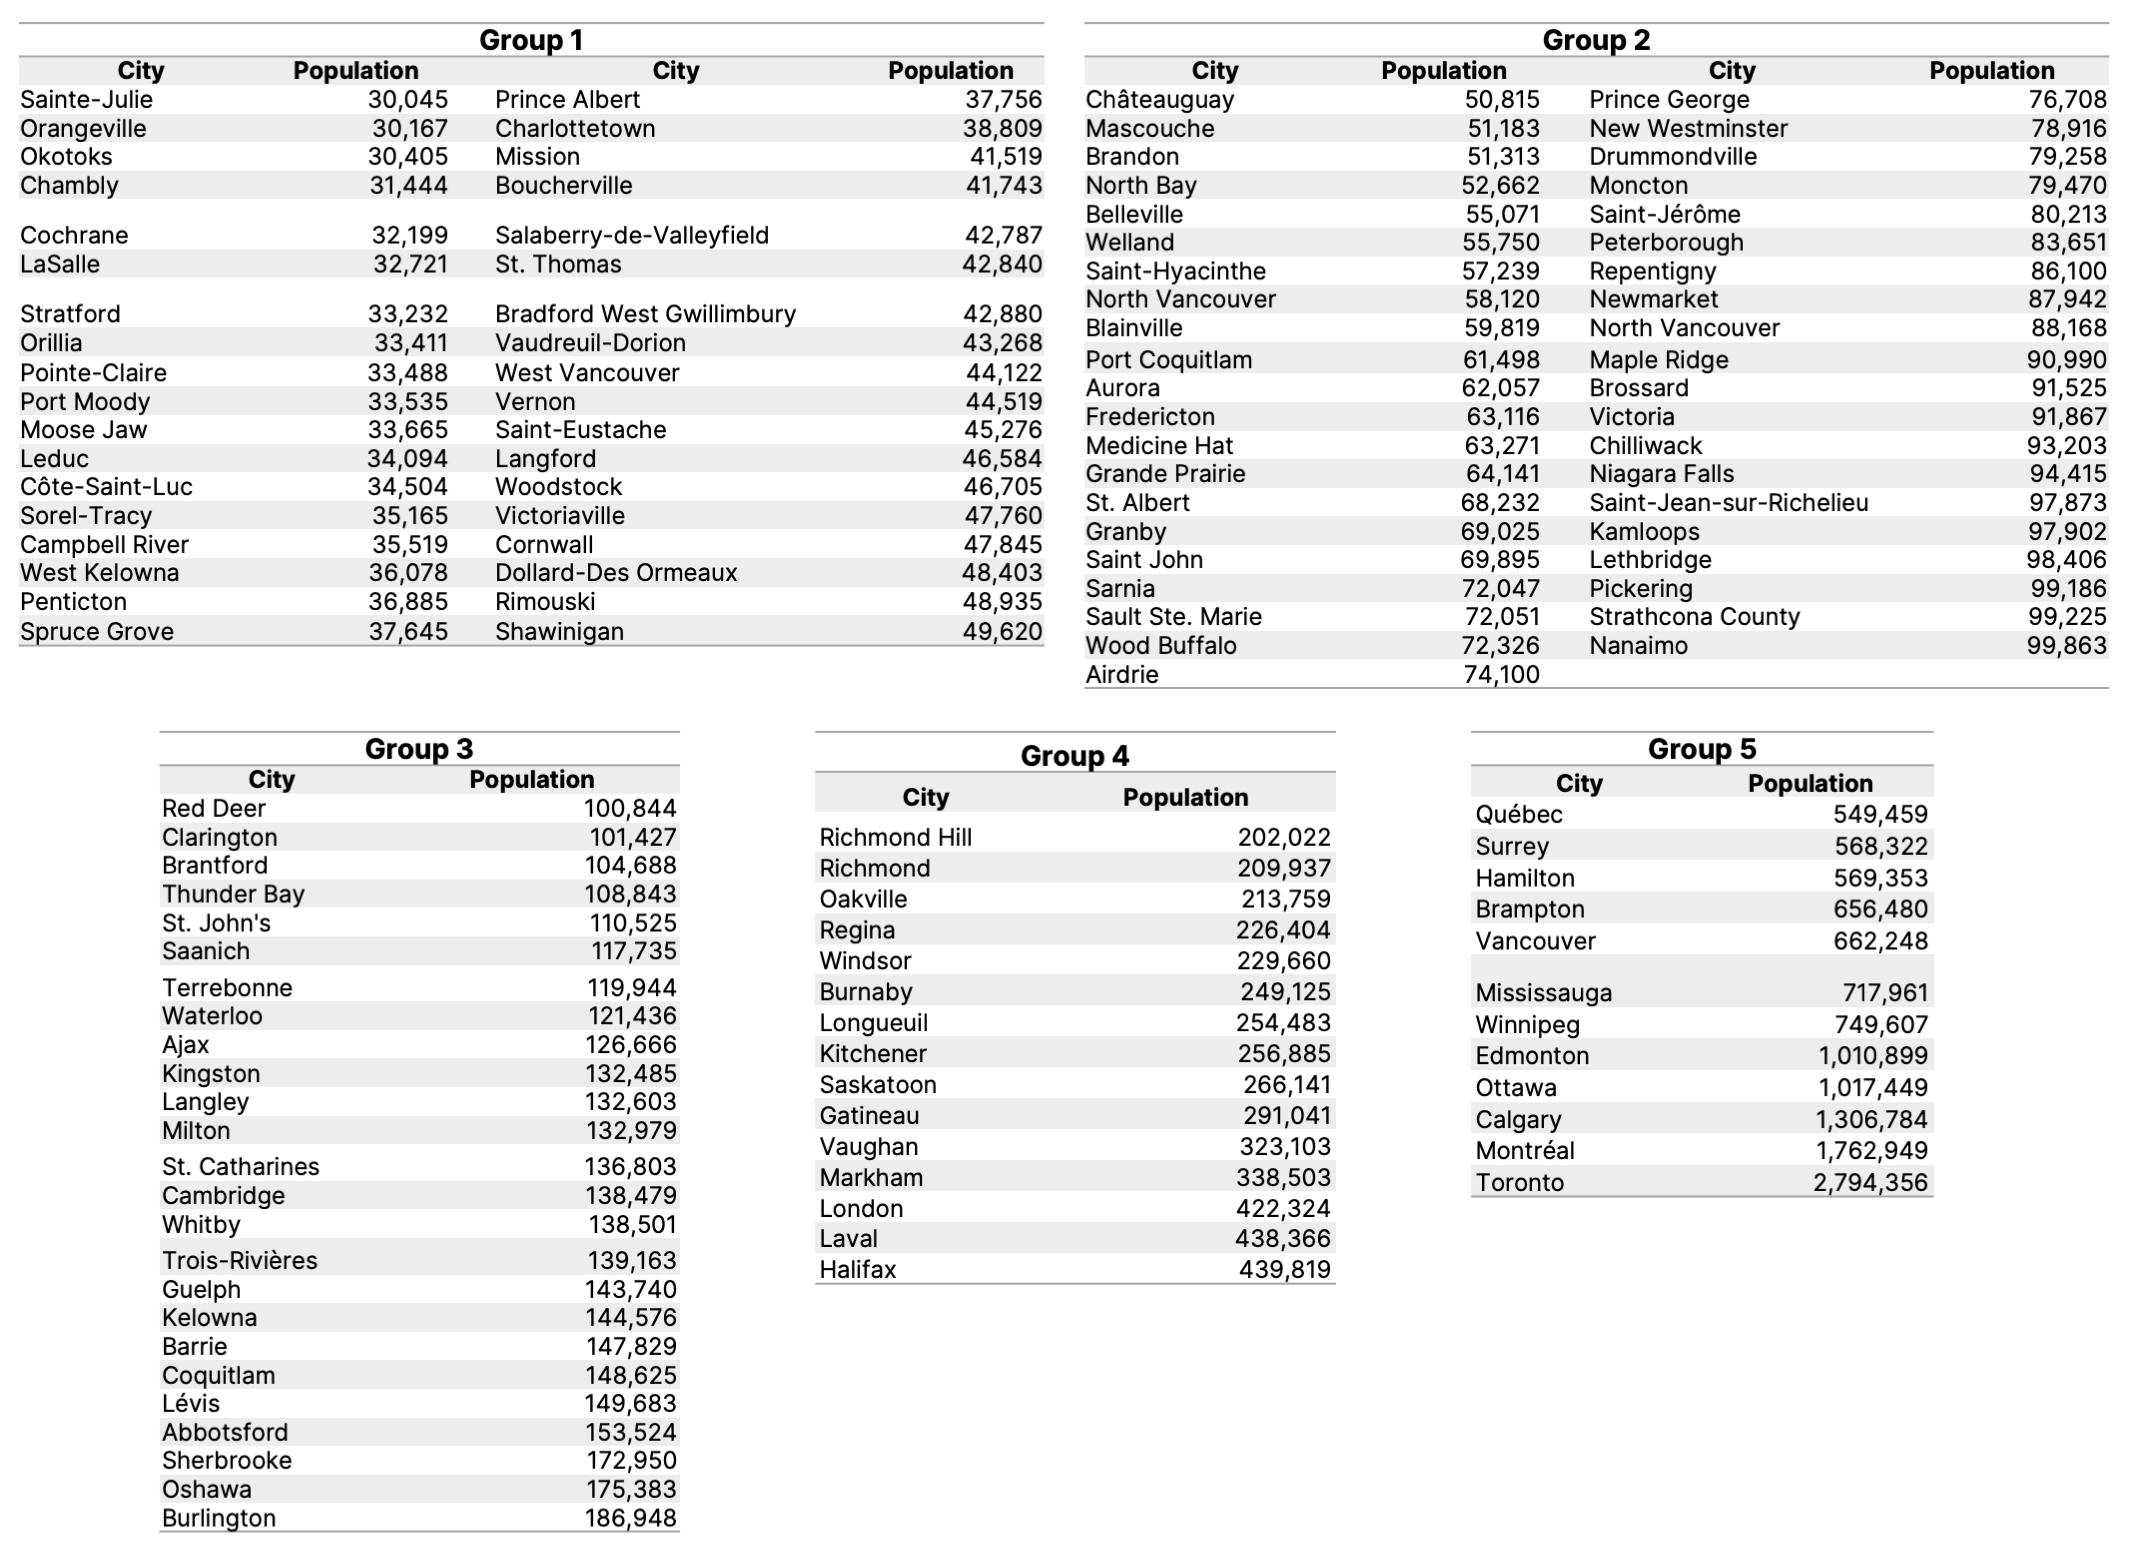
This window also ranks the selected city amongst similar-sized cities in terms of equitable distribution of built environment indicators. The most equitable cities are those with the lowest percentage of vulnerable populations living in less beneficial environment areas. To compare similar-sized cities, all cities included in HealthyPlan.City are divided into five groups based on population size: Group 1 are cities with populations of 30,000 to 50,000 individuals; Group 2 are cities with populations of 50,000 to 100,000 individuals; Group 3 are cities with populations of 100,000 to 200,000 individuals; Group 4 are cities with populations of 200,000 to 500,000 individuals; and Group 5 are cities with populations of over 500,000 individuals. Cities within each of these groups are ranked against each other in the histogram. A list of cities in each group is included at the end of this page.
Distribution
The Distribution window plots the built environment and vulnerable population indicators for each dissemination block in a city. Each dot in the scatter plot represents a dissemination block and shows its built environment and proportion of vulnerable population values on the vertical and horizontal axes, respectively. When a user clicks on a location on the map, a point on the scatter plot representing this location is highlighted.
Neighbourhoods
Toggling the Neighbourhoods function On outlines boundaries for neighbourhoods within cities. Neighbourhood boundaries are obtained from open data portals or from municipal staff and are available for some but not all cities included in the HealthyPlan.City tool. The boundaries defining neighbourhoods are based on publicly available data and are therefore not standardized; they include urban planning districts used for official community plans, electoral wards, and locally-defined neighbourhoods.
The Equity by the Numbers and Distribution functions are adapted when the Neighbourhood option is selected. For Equity by the numbers, the city-wide proportion of vulnerable population individuals in low beneficial built environments that live in a given neighbourhood is shown. This is calculated by dividing the number of vulnerable population individuals in low beneficial environments (individuals living in areas where vulnerable population ranks > 5 and built environment ranks <6; see Equity priority section) within a neighbourhood zone by the total number of vulnerable population individuals in low beneficial environments in a city. Neighbourhoods within a selected city are ranked against each other. For Distribution, the values of built environment indicators and the proportion of vulnerable population individuals are aggregated for all dissemination blocks within each neighbourhood zone. Each dot in the scatter plot represents a neighbourhood zone, allowing easy comparison across neighbourhoods in a given city.
Note that some neighbourhood zones are only partially covered by the urban boundary of a given city. In these cases, only dissemination blocks falling within the neighbourhood zones are considered in the calculations mentioned above.
List of Canadian cities included in HealthyPlan.City